

 |
 |
Rapid 3-D inversion of the frequency domain EM data
Among new methods, developed by CEMI in recent years, we should mention the development of the fast inversion technique for the multi-transmitter frequency-domain EM data. This method can be applied, for example, to interpretation of the helicopter-borne EM response over conductive or resistive targets. Full 3-D inversion of multi-transmitter frequency domain airborne data requires only few minutes on PC. The corresponding paper was published in the Geophysical Journal International (Zhdanov and Tartaras, 2002). Recently, we have developed a new technique for fast airborne data inversion which employs the spectral Lanczos decomposition method, SLDM (Chernyavskiy and Zhdanov, 2002). This technique helps to accelerate HEM data inversion and provides a stable and focused image of the geoelectrical target. This code can be applied (after a one-time precalculation of the forward operator) for the real-time inversion of airborne or crosshole EM data from hundreds of transmitter positions, using thousands of cells. The inversion process for more than 3300 cells and more than 300 transmitter-receiver positions takes approximately 25 seconds on an Ultra Sparc 10 workstation.
3-D inversion of synthetic helicopter-borne data
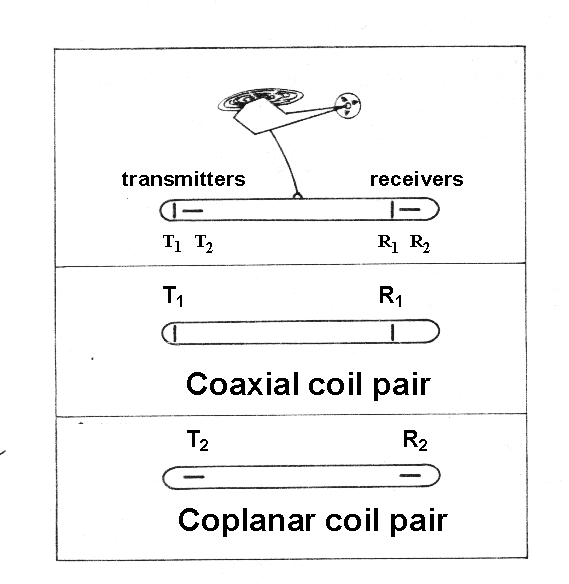
One of the important possible applications of the LQL inversion technique is the interpretation of frequency-domain helicopter-borne data. This type of airborne survey is used extensively in mining exploration (Figure 1).
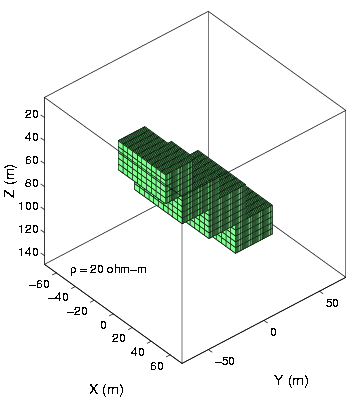
We use the integral equation code SYSEM (Xiong, 1992) to simulate such a survey over a dipping, conductive dike located in a resistive (500 ohm-m) half-space (Figure 2).
Five lines were flown over the target at an altitude of 30 m and at a distance of 25 m from each other (Figure 3).
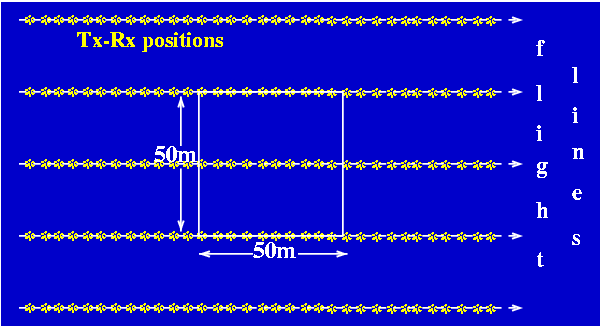
The moving transmitter-receiver system was a pair of vertical magnetic dipoles (simulating a horizontal coplanar coil pair), and a pair of horizontal magnetic dipoles (simulating a veretical coaxial coil pair), with 8 m horizontal separation. The yy and zz components of the anomalous magnetic field were measured every 15 m along the lines (130 observation points in each line). Two frequencies were used: 900 Hz and 7.2 KHz.
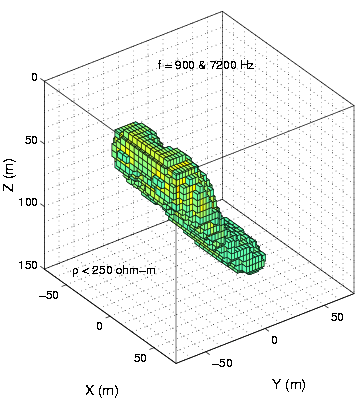
The synthetic data were contaminated with 5% random noise and then inverted using the LQL inversion method. The inverted area, centered around the body, was 150m*150m*150m, and was divided in 12*12*12 cells. The results (3-D inversion image) are shown in Figure 4. We can clearly locate the dike and determine its dip direction, as well as some details of its shape. Its resistivity, however, is overestimated.
3-D inversion of HEM data collected for mineral exploration
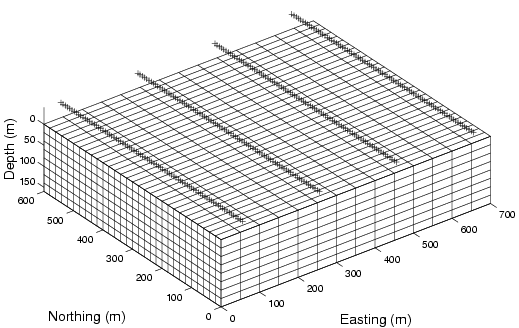
We have inverted HEM data collected with the Dighem system (Fraser, 1979) for mineral exploration puproses in the Voisey's Bay area in Canada. This area is characterized by high-conductivity Ni-Cu sulphide deposits hosted by resistive troctolite dikes. The inverted data set consisted of 332 different transmitter-receiver points and the inverted area was divided into 14*30*8 cells. The inverted volume and the superimposed flight lines are shown in Figure 5.
The results are shown in Figures 6 and 7, as successive cross-sections. We can clearly locate the extent of the mineralization.
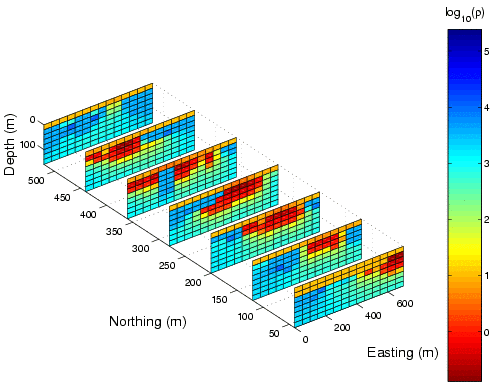
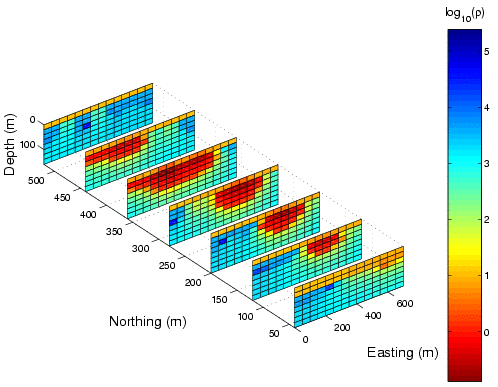
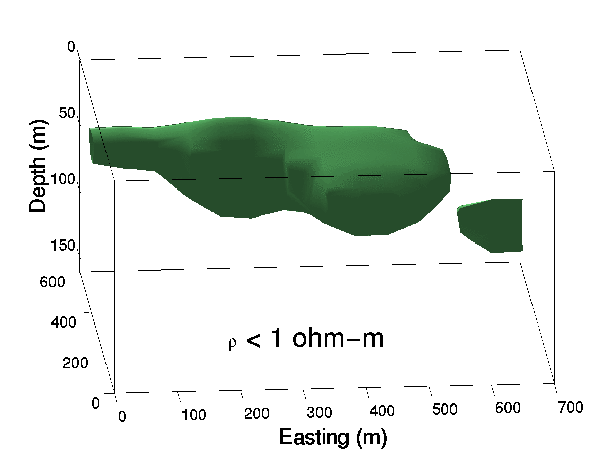
Figure 8 shows a 3-D image of the same result. The volume-rendered image shows only resistivity values less than 1 ohm-m
References
Chernyavskiy, A. and M. S. Zhdanov, 2002, Fast 3-D inversion of helicopter-borne electromagnetic data using the spectral Lanczos decomposition method: Proceedings of 2002 CEMI Annual Meeting, 339-382.
Fraser, D.C., 1979, The multicoil II airborne electromagnetic system: Geophysics, 44, 1367-1394.
Xiong, Z., 1992, EM modeling of three-dimensional structures by the method of system iteration using integral equations: Geophysics, 57, 1556-1561.
Zhdanov, M. S., and E. Tartaras, 2002, Inversion of multi-transmitter 3-D electromagnetic data based on the localized quasi-linear approximations: Geophysical Journal International, 148, No. 3, 506-519.
Zhdanov, M. S. 2002, Geophysical inverse theory and regularization problems: Elsevier, Amsterdam - New York - Tokyo, 628 pp.