
 |
 |
Modeling of tensor induction well logging in a deviated well
By Michael Zhdanov, David Kennedy, Arvidas Cheryauka, and Ertan Peksen
The identification of hydrocarbons and quantification of hydrocarbon pore volume in so-called ``low resistivity pay'' reservoirs has been a perennial problem for petrophysicists. More recently, the correct interpretation of resistivity logs in highly deviated and horizontal wells has challenged the petrophysicist's understanding of resistivity instrument responses and reservoir resistivity distribution, particularly in anisotropic reservoirs. New resistivity instrumentation promises to mitigate or remove these difficulties.
We examine the response of a tri-axial electromagnetic induction logging instrument in a deviated well penetrating a transversely isotropic medium. The instrument responds to three mutually orthogonal components of magnetic field excited by each of three mutually orthogonal transmitters, the responses comprising a nine component induction tensor. Zhdanov et al. (2001) derived low frequency approximations for the quadrature components of the induction tensor by theoretically analyzing this tri-axial induction instrument for its response to magnetic field components induced in an infinite, homogeneous, anisotropic medium. The analysis showed that the tensor components of conductivity and their orientation can be resolved from the quadrature components of the instrument response, providing a basic tensor logging instrument response interpretation. We further examine the basic principles of tensor induction logging in two-, three-, and multi-layer anisotropic formations in vertical and deviated wells using numerical simulations of tensor induction well logging (TIWL) data. We develop a technique for correct reconstruction of the apparent conductivities of the anisotropic formations, based on application of a regularized Newton method. We demonstrate the effectiveness of this technique for interpretation of tensor induction log data in a deviated well in an anisotropic medium. The method is fast and provides a ``real time'' interpretation.
We considered the simplest case of a layered model of rock formation without a borehole and invaded zones. The tensor induction tool has three mutually orthogonal transmitters and three mutually orthogonal receivers, with the ``vertical'' transmitter and receiver oriented along the deviated borehole. The distance between the transmitter's position and the receiver's position was 1.0 m. The calculations were performed for a tool moving along a borehole, sampled every 0.25 m. The operating frequency was 20 kHz. The synthetic data were computed using a library of 3-D Green's tensors in layered anisotropic formations (Cheryauka and Zhdanov, 2001a).
We assume that tensor induction logging is conducted by a tool coaxial with a borehole. We calculate the model responses (induction tensor components) for the different positions of the tool along the borehole. Using these responses as the synthetic data, we compute the low frequency apparent conductivities as an initial model. Then more accurate estimations of the apparent conductivities were computed using the Newton inversion. The results were plotted as apparent resistivity curves versus depth for a different dip angles, which are equal to 0 and 85 degrees, respectively (Figure 1and 2). The data were contaminated by 3 % random Gaussian noise at each observation point. The boundary cannot be seen by using the apparent resistivity expression for the horizontal apparent resistivity. But the vertical apparent resistivity clearly responds to the position of the boundary.


Figure 3 and 4 depict the second numerical example. We consider a model of a three-layer formation. This model is a very good example of a practical situation where conventional induction logging can miss a geological structure. The layer thickness is 5m. There is no horizontal conductivity variation in this model, while the vertical conductivity of the second layer is different from the top and bottom layers. On the second panel from the left, representing the horizontal apparent resistivities, we cannot see any indication of the second layer. However, it is possible to determine the layer boundaries by using vertical resistivity information (the third panel from the left). The last panel displays the anisotropy coefficient values versus depth.


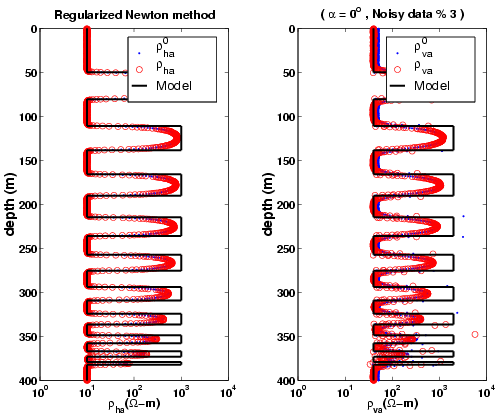
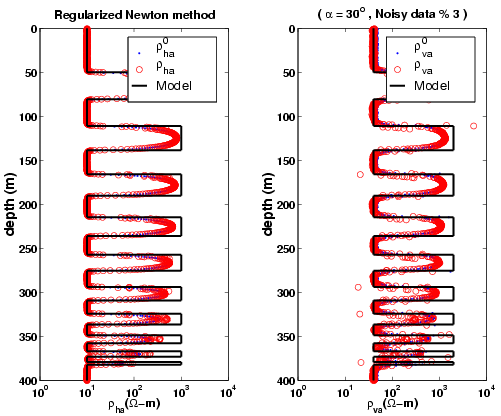
We considered two multi-layered models of anisotropic formations, based on the well known benchmark models: ``Oklahoma'' model, and ``Chirp'' model. The first multi-layered model is the ``Oklahoma'' model (Barber et al., 1999). In our anisotropic model we use the same horizontal resistivity as in the original ''Oklahoma'' model (solid line in the left panel of Figure 5) but we also add some anisotropy to the model by assigning various vertical resistivities (solid line in the right panel of Figure 5). We simulated the synthetic data for this model using a library of 3-D Green's tensors in the layered anisotropic formation (Cheryauka and Zhdanov, 2001). The computer simulated data for this model with 3% random noise added were processed using the TIWL interpretation technique outlined above. The results of interpretation for the dip angles of 0 and 30 degrees are presented in Figure 5 and 6. The solid lines show the true parameters of the model. The apparent resistivities and anisotropy coefficient, obtained by the low frequency asymptotics, are shown by the dotted lines. The circles represent the inverted apparent resistivities and anisotropy coefficient, computed using the Newton method. One can see that we can reconstruct well the horizontal resistivity distribution, while the vertical resistivity is mostly underestimated in this case.


The second model is the ``Chirp'' model (Fang and Wang, 2000), represented by a solid line in the left panel of Figure 7 (the horizontal resistivity profile). We modified this model, adding a profile of vertical resistivity (right panel in Figure 7). The results of the synthetic TIWL data interpretation for different dip angles are shown in Figure 7 and 8. Once again the apparent resistivities describe well the horizontal resistivity, but recover the vertical resistivity much less successfully.


In this paper we examined the basic principles of tensor induction well logging (TIWL) in the deviated borehole in anisotropic layered formations. We introduced a simple technique of TIWL data interpretation based on calculating the components of the apparent conductivity tensor (``horizontal'' and ``vertical'' apparent conductivity). In the case of low frequency asymptotics, we can use the analytical expressions for apparent conductivity (or resistivity) tensor calculations. In the higher frequency range, one can use a regularized Newton method to generate the corresponding apparent conductivities (or resistivities) of the anisotropic media.
We analyzed the responses of synthetic tensor induction logs in the deviated borehole through two-, three-, and multi-layer anisotropic formations in vertical and deviated wells using numerical simulation. Our results demonstrate that the tensor instrument is sensitive to anisotropic parameters of geological formations. These cannot be detected in a general case by conventional induction logging.
At the same time, we found that the simple interpretation tool based on the apparent resistivity model cannot well resolve the different anisotropic layers in the case of the complicated geoelectrical models. There is a need to develop a more advanced technology for TIWL data interpretation based on multilayered inversion.
References
Barber, T. D., Broussard, T., Minerbo, G. N. Sijercic, Z. and D. Murgatroyd, 1999, Interpretation of multiarray induction logs in invaded formations at high relative dip angles: The Log Analyst, 40, No 3 (May-June), 202 - 217.
Fang, S., and T. Wang, 2000, Accurate Born simulation of induction response using an optimal background: SEG 2000 Expanded Abstracts, Calgary, 1806-1809.
Cheryauka, A. and M. S. Zhdanov, 2001a, Electromagnetic tensor Green's functions in transverse isotropic layered media: IEEE Transactions on Geoscience and Remote Sensing, in submission.
Cheryauka, A. and M. S. Zhdanov, 2001b, Focusing inversion of tensor induction logging data in a deviated well in layered anisotropic formations: Petrophysics, in submission.
Zhdanov, M. S., Kennedy, D., Cheryauka, A, and E. Peksen, 2001, Principles of the tensor induction well logging in a deviated well in an anisotropic medium, 42th SPWLA Transactions, in press.
Zhdanov, M. S., 1993, Tutorial: Regularization in inversion theory; Colorado School of Mines, Golden, Colorado, CWP-136,47pp.
Zhdanov, M. S., Kennedy, D., and E. Peksen, 2001, Foundations of tensor induction well logging: Petrophysics, in press.