

 |
 |
3-D gravity and/or magnetic inversion with image focusing and data compression
By Oleg Portniaguine and Michael Zhdanov
Interpretation of three-dimensional gravity and/or magnetic data over inhomogeneous geological structures is still a challenging problem of exploration geophysics. The traditional geophysical inversion methods are usually based on using maximum smoothness stabilizing functional. The obtained solution usually provides a smooth image, while the real geological structures are typically characterized by the strong contrast in the physical properties of the different blocks and layers. In the paper (Portniaguine and Zhdanov, 1999) we introduced a new approach to reconstruction of geological images, which is based on using specially selected minimum support or minimum gradient support stabilizing functionals. These functionals allows to obtain sharper image while generating a stable solution of the inverse problem for complex geological structure. We call this approach focusing inversion images. The methods of image focusing and data compression have been applied to 3-D potential field inverse problem. Focusing allows resolution of the structures with sharp boundaries. It is especially important for potential fields where the smooth invertion often looks simply similar to the observed data and thus provides little additional information. The compression allows inverting large datasets (such as airborne data) with the modest computing resources (Portniaguine and Zhdanov, 1999; Portniaguine, 1999; Zhdanov et al., 1999). The following model study and real data example illustrate the principles of 3-D magnetic inversion with focusing and compression.
Model study
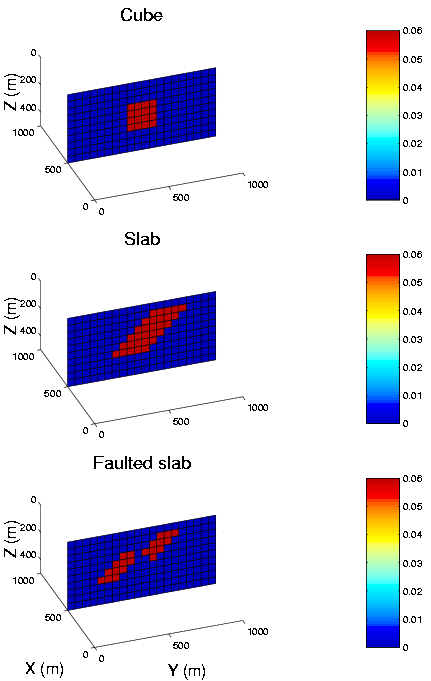
We considered three models similar to those discussed in the paper by Li and Oldenburg (1996). The models were 1) a model of a cube with the anomalous magnetic susceptibility (Figure 1, top panel); 2) a 3-D magnetic susceptibility model of a dipping slab (Figure 1, middle panel); and 3) a 3-D magnetic susceptibility model of a faulted slab (Figure 1, bottom panel). Upper panel shows model of a cube, middle panel shows model of a dipping slab, and lower panel shows model of a faulted dipping slab.
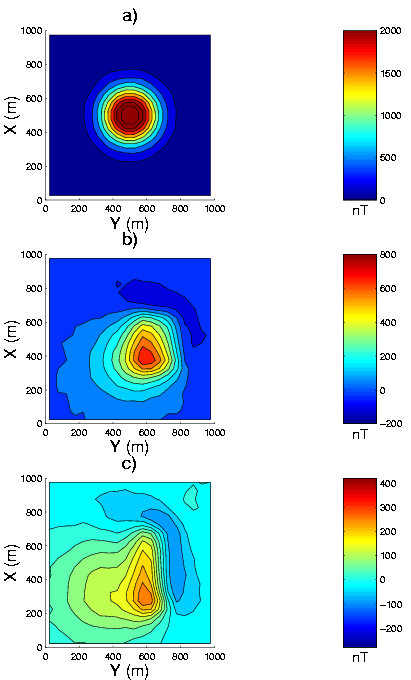
Figures 3, 4, and 5 present the inversion results for all three models.
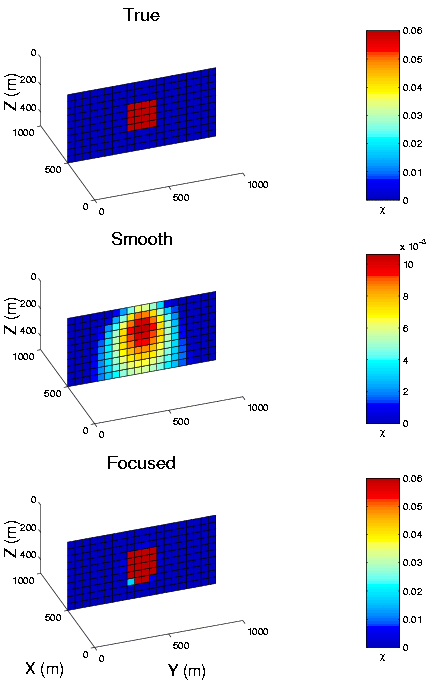
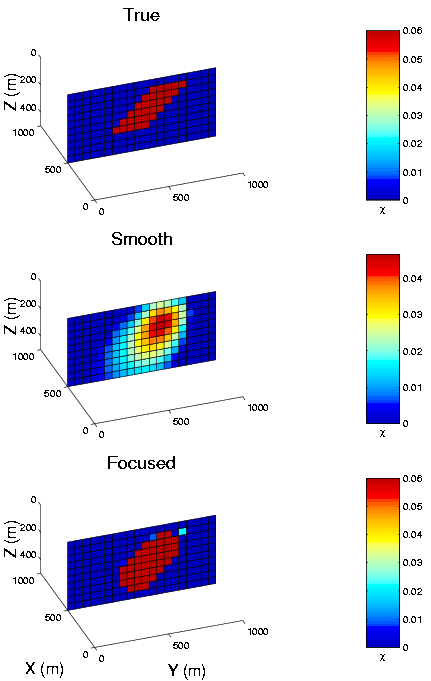
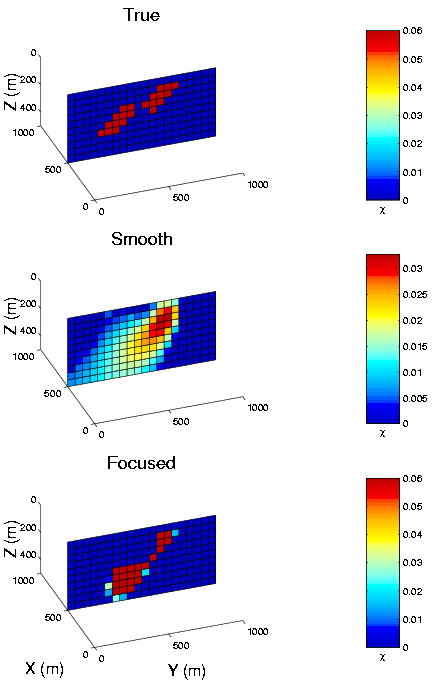
The smooth images provide useful information about the location and geometry of the models, but the images are diffused and unfocused, while the focusing inversion reconstructs very well the original models of the cube and the slab. The fault is practically invisible in the smooth image, while it can be clearly recognized in the sharp image.
>Interpretation of airborne magnetic data
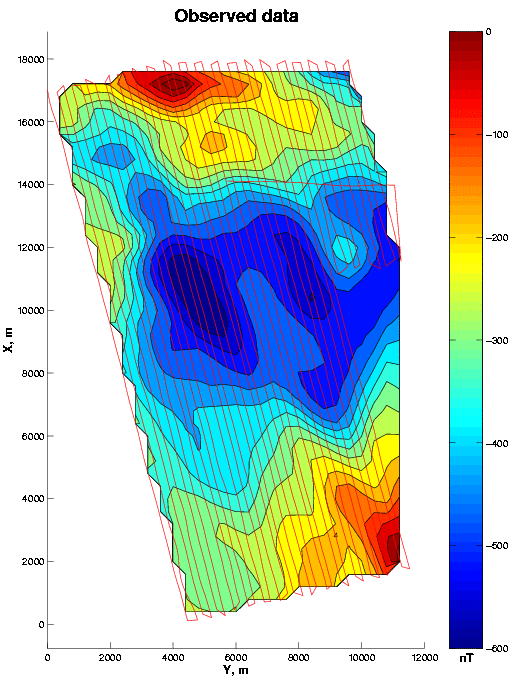
Figure 6 presents the observed airborne magnetic data, provided by ExxonMobil Upstream Research Co (Portniaguine and Zhdanov, 2000). Red lines show the flight path.
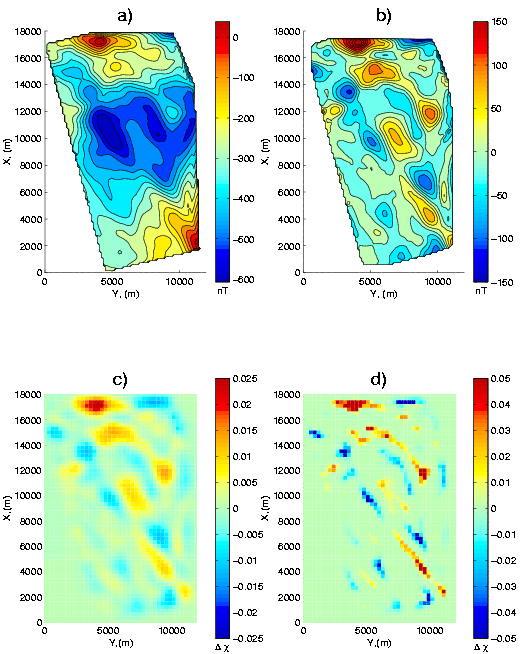
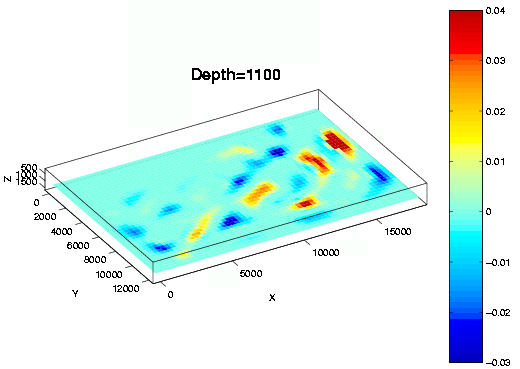
We applied to this data the conventional smooth inversion and the new developed inversion method with focusing and compression. Figures 7-9 show the results of the inversion.
References
Li, Y., and D. Oldenburg, 1996, 3-D inversion of magnetic data: Geophysics, 61, No. 2, 394-408.
Portniaguine O., and M.S. Zhdanov, 1999, Focusing geophysical inversion images: Geophysics, 64, No. 3, 874-887.
Portniaguine O., 1999, Image focusing and data compression in the solution of geophysical inverse problems: PhD dissertation, University of Utah.
Portniaguine, O. and M.S. Zhdanov, 1999, Compression in inverse problem solution: Proceedings of 1999 CEMI annual meeting, 595-618.
Portniaguine O., and M. S. Zhdanov, 2002, 3-D magnetic inversion with data compression and image focusing: Geophysics, 67, No. 5, 1532-1541.
Zhdanov, M.S., Portniaguine O., and G. Hursan, 1999, Compression in 3-D EM integral equation electromagnetic modeling: Second International Symposium of Three-Dimensional Electromagnetics, University of Utah, 209-212.