

|
|
|
3-D inversion of the marine electromagnetic data for petroleum exploration
By Le Wan and Michael S. Zhdanov
Seismic methods are usually the methods of choice in exploration for oil and gas. However, there are many areas of the world where petroleum reservoirs are buried in formations with complex geological structures, which make seismic data difficult to interpret. One such difficult area is associated with the seabottom salt structures, typical for many offshore regions (for example, the Gulf of Mexico, or Angola offshore). At the same time, the resistivity of the petroleum reservoir and of the salt structures is usually on an order greater than that of surrounding sea-bottom sediments. That is why these structures can be considered easily detectable targets for marine electromagnetic methods
3-D inversion of the sea-bottom magnetotelluric data
We have carried out in CEMI a model study to test the feasibility of using a marine MT method for offshore petroleum exploration. We considered a schematic model of an offshore Angola sea-bottom petroleum reservoir in the presence of a salt dome structure (Figure 1). The synthetic data set was generated by the IE modeling code INTEM3D, based on the Contraction Integral Equation (CIE) method (Hursan and Zhdanov, 2002). We have applied the CEMI QAINV3D code to the interpretation of the synthetic marine MT data (Le Wan and Zhdanov, 2003). A new version of the code uses the quasi-analytical approximation as a forward operator (Zhdanov et al., 2000) in the initial stage of inversion and the rigorous contraction integral equation based forward modeling at the final stage of inversion (Hursan and Zhdanov, 2002). The results of our feasibility study demonstrate that, with MT data in 0.0003-1 Hz, the petroleum reservoir could indeed be mapped with reasonable accuracy.
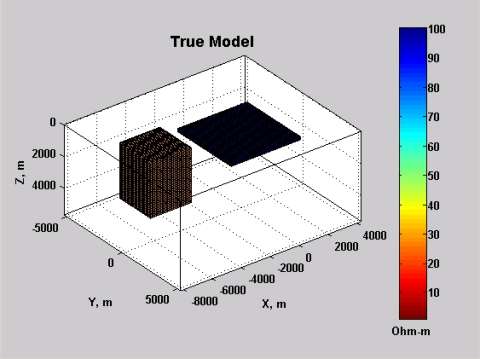
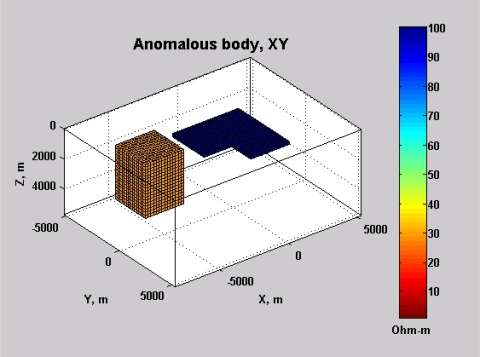
Figures 1 shows a plan view and a vertical cross-section of a synthetic model of a sea-bottom petroleum reservoir. The sea-bottom reservoir is approximated by a thin resistivity body located at a depth of 1000 m below the sea-bottom, with a thickness of 200 m, and a horizontal size of 5000 m X 5000 m. The resistivity of the reservoir is 100 Ohm-m. There is located, also, a salt dome structure close to the reservoir, at a depth of 250 m below the sea-bottom, with a size of 3000 m X 3000 m X 4750 m in the x, y, and z directions. The resistivity of a salt dome is 30 Ohm-m. The depth of the sea-bottom is 1000 m from the surface, and the sea water resistivity was assumed equal to 0.25 Ohm-m. A 3-D image of the true model is shown in Figure 2. This model is excited by the vertically propagated plane electromagnetic wave with eight different frequencies : 1, 0.3, 0.1, 0.03, 0.01, 0.003, 0.001, and 0.0003 Hz . The magnetotelluric (MT) stations are located at the sea-bottom along 16 lines parallel to the axis X with 22 observation points in each line. Note that most of the observation sites are located above the reservoir model. The separation between the lines is 500 m, the observation step along the line is 500 m as well.
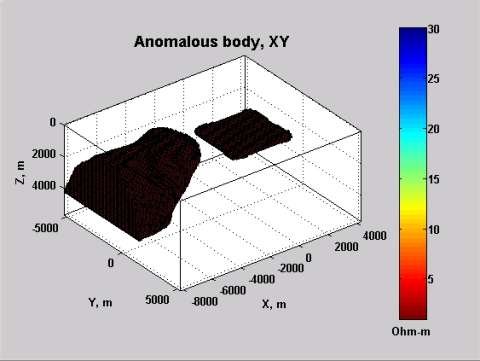
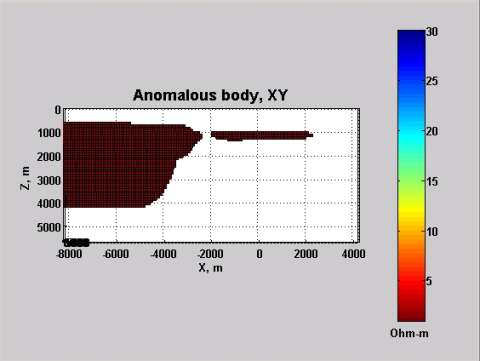
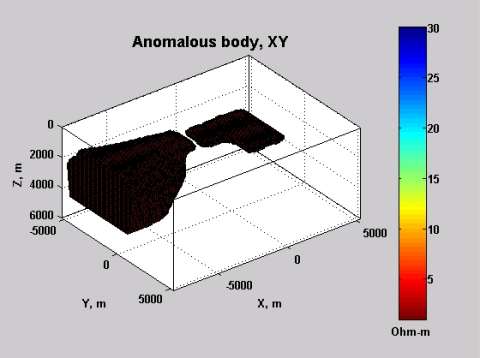
The synthetic MT data were computed using INTEM3D code and were contaminated by 3 percent random noise. These synthetic data were used for 3-D nonlinear inversion. The area of inversion, located under the sea-bottom, was divided into 26 x 22 x 9 = 5148 cells with each cell size of 500 m X 500 m X 250 m. A 3-D image of the inversion result is shown in Figure 3. The remarkable fact is that the inversion of MT data observed in the area of the reservoir location only, reconstructs both the reservoir and a salt dome. A vertical cross-section of 3-D inversion result for a model of a sea-bottom petroleum reservoir is shown in Figure 4. The depth and thickness of the reservoir are recovered quite well, while the shape of the salt dome is slightly distorted, because the MT survey was conducted only above the reservoir.
We have run a similar experiment for a model of a sea-bottom petroleum reservoir, which has an L-shape (Figure 5). The result of inversion of the synthetic MT data computed for this model is shown in Figure 6. One can see that we can reconstruct the shape of the reservoir and its location with the reasonable accuracy.
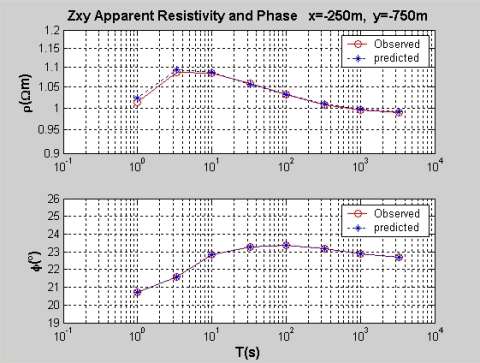
Figures 7 presents a theoretical MT sounding curve, computed for a synthetic model of a sea-bottom petroleum reservoir at the observation point close to the center of the reservoir, and the same curve for the inverse model. We can see that the observed and predicted data fit each other with a high accuracy.
Note that, the computational time for our 3-D inversion does not exceed twenty minutes on 1 GHz PC.
REFERENCES
Hursan, G. and M. S. Zhdanov, 2002, Contraction integral equation method in 3-D electromagnetic modeling: Radio Science, 37, No. 6, 1089.
Le Wan and M. S. Zhdanov, 2003, Three-dimensional modeling and inversion of sea-bottom MT data for petroleum exploration: Proceedings of 2003 CEMI Annual Meeting, 279-294.
Zhdanov, M. S., Dmitriev, V, I., Fang, Sh., and G. Hursan, 2000, Quasi-analytical approximation and series in 3D electromagnetic modeling: Geophysics, 65, 1746-1757.