

 |
 |
Modeling and Inversion of the Sea Bed Logging (SBL) Electromagnetic Data for Petroleum Exploration
By Ken Yoshioka and Michael S. Zhdanov
One of the important problems in marine geophysics is the development of new techniques for the remote and direct identification of hydrocarbon reservoirs in deepwater areas based on EM measurement. The Sea Bed Logging (SBL) method uses a mobile horizontal electric dipole (HED) transmitter and an array of seafloor electric receivers (Eidesmo et al., 2002). The seafloor receivers measure the low frequency electrical field generated by the HED source from different positions. Thus, an observational survey consists of many transmitters and receivers located over the examined sea-bottom area (Figure 1). A simple analysis of the observed data based on 1-D and 2-D modeling, given in Eidesmo et al., 2002, demonstrates that these data are sensitive to the resistive hydrocarbon reservoir typically located within conductive sea-bottom host rocks.
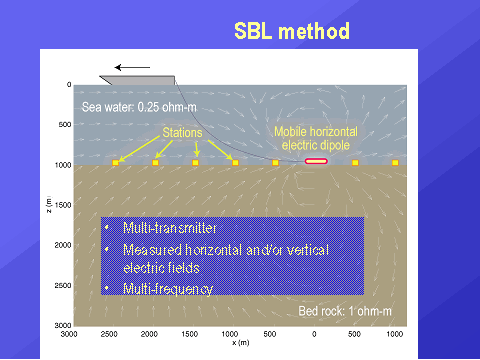
Figure 1
We should note, however, that the interpretation of the SBL data collected over a 3-D reservoir is a very challenging problem, which cannot be solved based on a simple 1-D or 2-D modeling. One could imagine that the 3-D effects play an extremely important role in forming the overall pattern of current flow in the sea-bottom formations. However, the analysis of this pattern becomes a very complicated problem due to large number of transmitting HED used in the SBL method. Consequently, the rigorous 3-D inversion of SBL data poses enormous computational difficulties.
In the framework of the Sea Bed Logging project conducted by CEMI, we apply an integral equation method to examine the typical electric field data collected by the SBL survey. We also develop a new technique for 3-D inversion of SBL data. This technique is based on the recently developed localized quasi-linear (LQL) approximation for the electromagnetic field, which is source independent (Zhdanov and Tartaras, 2002). The LQL approximation makes it possible to model and invert the seafloor electrical data simultaneously for all positions of the transmitters and receivers (Yoshioka and Zhdanov, 2003). This powerful technique allows us to overcome the major difficulty of the SBL data interpretation, mentioned above, and thus, opens the way for a full 3-D inversion of the SBL data for petroleum exploration.
We also investigate different aspects of SBL technology. One important question is what kind of electrical measurements are the most efficient for studying sea-bottom formations? The current methodology is based on recording only the horizontal components of the electric field at the receivers. However, it was demonstrated by Berdichevsky et al. (1989) and Golubev and Zhdanov (1999) for the MT data that at the sea-bottom the strongest anomalies are observed for the horizontal magnetic field components, Hx and Hy, and for the vertical electric field component, Ez. This is why it seems reasonable to suggest measuring the Ez component in the SBL method as well. We demonstrate that recording the vertical electric field component increases the resolution of 3-D inversion of the SBL data for off-shore petroleum exploration (Yoshioka and Zhdanov, 2004).
Computer simulation of the SBL survey for petroleum exploration
We consider a synthetic model of a sea bottom petroleum reservoir. Figures 2 and 3 show a plan view and a vertical cross-section of the model. The sea bottom reservoir is approximated by a thin resistive body located at a depth of 1000 m below the sea bottom, with a thickness of 200 m, and a horizontal size of 5000 m X 5000 m. The resistivity of the reservoir is 100 Ohm-m. The depth of the sea bottom is 1000 m from the surface, and the sea water resistivity was assumed equal to 0.25 Ohm-m.
The mobile horizontal (y- oriented) electric dipole (HED) transmitters have a length of 100 m and are moving at a depth 50 m above the sea bottom along nine lines: A, B, C, ... and I (see Figure 4). They generate the EM field at three different frequencies: 0.25; 1; and 4 Hz. The separation between the transmitted dipole centers along the line is 1000 m and the separation between the lines is 1000 m. An array of seafloor electric receivers is located 5 m above the sea bottom along the same lines with the same separation between the receivers of 1000 m. In total, we have 15 receivers in each of the nine lines.
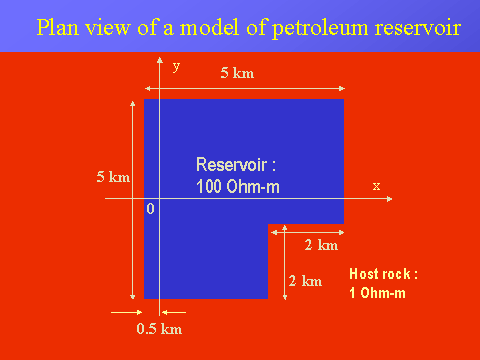
Figure 2
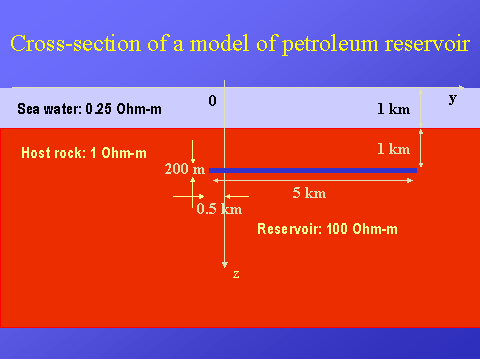
Figure 3
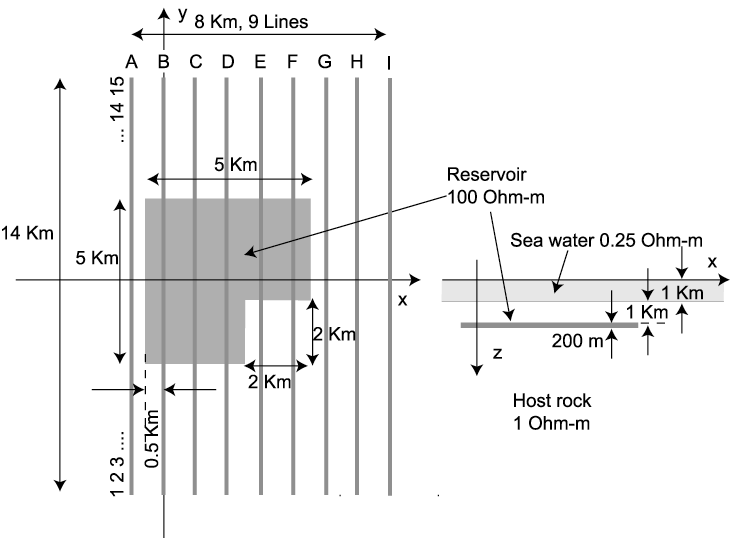
Figure 4
In the first numerical experiment, we assume that the receivers measure the horizontal components, Ex and Ey, of the electric field only. The synthetic EM data for this model were generated using the integral equation forward modeling code, INTEM3D (Hursan and Zhdanov, 2002).
The plan view and the vertical cross-sections of the original model and the result of the inversion for the synthetic SBL data is shown in Figure 5. The white solid line shows the contour of the reservoir. One can see that the reservoir is manifested by a light yellow blue area. The image of the reservoir is relatively weak, because its resistivity is underestimated.
Figure 6 presents the plan view and the vertical cross-sections of the true model and of the geoelectrical model obtained by the inversion of all three components of the electric field, Ex, Ey, and Ez. We can clearly see the reservoir in this figure. The location and the shape of the reservoir are recovered quite well, and the resistivity is estimated correctly.
Note that the modern sea bottom EM equipment has the capability of measuring the three components of the electric field.
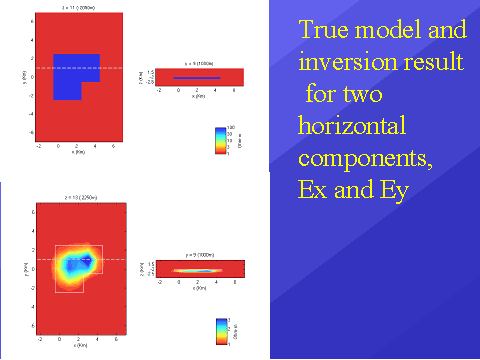
Figure 5
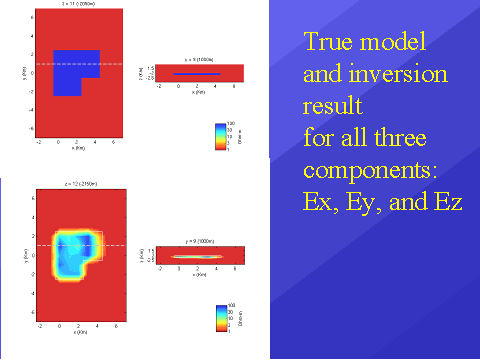
Figure 6
Conclusion
CEMI has developed a new technique for 3-D interpretation of the sea-bottom electrical profiling data, collected with a mobile horizontal electric dipole (HED) transmitter and an array of the seafloor electric receivers (Seabed Logging Method). Our method is based on the localized quasi-linear approximation, which allows simultaneous inversion of multitransmitter electrical data. We apply this method to interpretation of the synthetic EM data simulated for the model of a sea-bottom petroleum reservoir. Our results demonstrate that the SBL method with the LQL-based 3-D interpretation can be effectively used for sea-bottom reservoir detection.
Future work will be directed to the interpretation of the practical marine electromagnetic data.
References:
Berdichevsky, M. N., Zhdanova, O. N., and Zhdanov, M. S., 1989, Marine deep geoelectrics: Nauka, Moscow.
Eidesmo, T., S. Ellingsrud, L. M. MacGregor, S. Constable, M. C. Sinha, S. Johansen, F. N. Kong and H. Westerdahl, 2002, Sea Bed Logging (SBL), a new method for remote and direct identification of hydrocarbon filled layers in deepwater areas: First break, 20, 144-152.
Golubev, N. G., and Zhdanov, M. S., 1999, Comparative study of land and sea bottom geoelectric anomalies: Proc. Ann. Mtg., Consortium for Electromagnetic Modeling and Inversion, 175-218.
Hursan, G., and Zhdanov, M. S., 2002, Contraction integral equation method in three-dimensional electromagnetic modeling: Radio Sci., 37 (6), 1089, doi: 10.1029/2001RS002513.
Zhdanov, M. S., and Tartaras, E., 2002, Three-dimensional inversion of multitransmitter electromagnetic data based on the localized quasi-linear approximation: Geophys. J. Int., 148, 506-519.
Yoshioka, K., and Zhdanov, M. S., 2003, Interpretation of the sea bed logging data using the LQL method: 73rd Ann. Internat. Mtg., Soc. Expl. Geophys., Expanded abstracts.
Yoshioka, K., and Zhdanov, M. S., 2004, Sea bed logging with three-component electrical receivers: 74th Ann. Internat. Mtg., Soc. Expl. Geophys., Expanded abstracts.